Sergio Flores/Bloomberg via Getty Images
Where does your state rank?
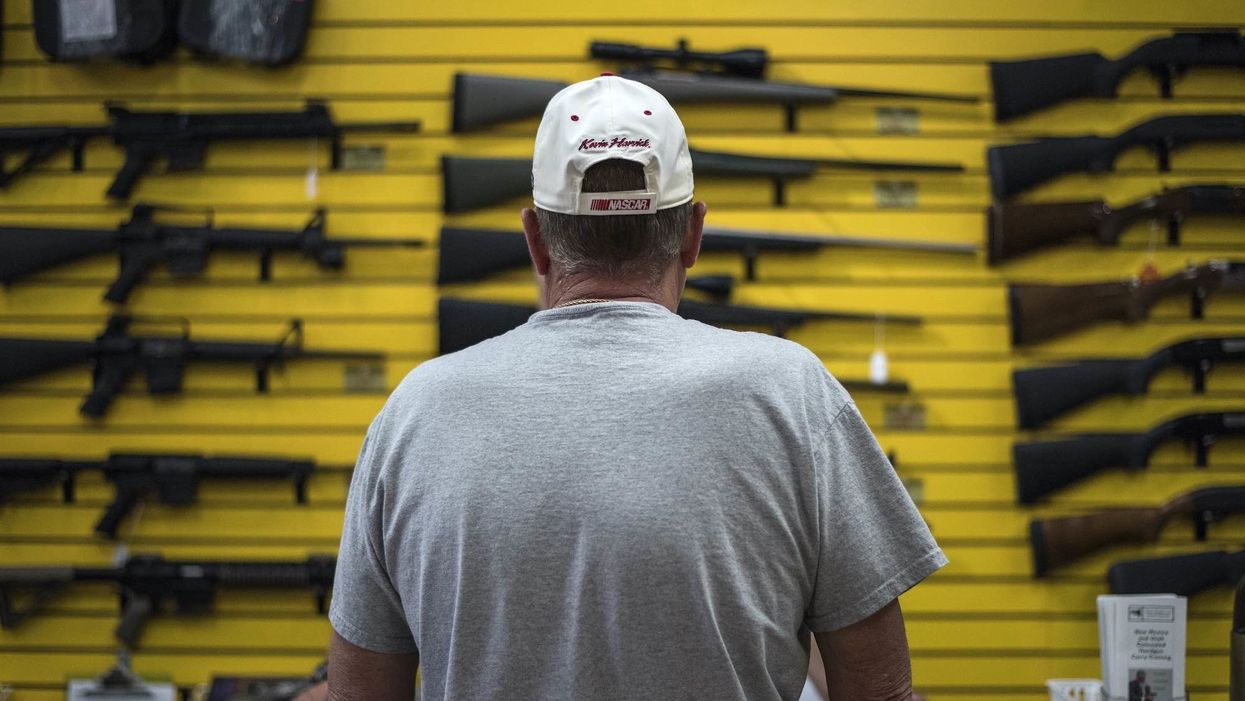
A new report shows that household gun ownership in America has gone down over the last 40 years, and nearly every state in the union has followed that trend. There are currently only 11 states where at least 50% of households have firearms.
The Rand Corporation updated its Gun Policy in America initiative this week with a new report on gun ownership rates in the U.S. since 1980. The new report, "State-Level Estimates of Household Firearm Ownership," shows the rate of household gun ownership for every state compared to the national average.
According to Rand's research, 45% of American households had firearms in 1980. By 2016 (the most recent data available), that rate had dropped 13 points to 32%.
The decline happened in almost every state — from the most pro-gun to the most anti-gun.
For example, the five "best gun-friendly states" as ranked by Guns & Ammo magazine — Arizona, Idaho, Alaska, Kansas, and Oklahoma — all saw their rates of household gun ownership fall.
The magazine's five "worst gun-friendly states" — California, Hawaii, New Jersey, Massachusetts, and New York — saw similar drops:
So, which states have the highest and lowest rates of household gun ownership? We rank them below, based on Rand's most recent data available. You'll also see where the states stood in 1980 (the furthest back the report goes), as well as each state's most recent record highs and lows within the data set.
● 2016 Rate: 63%
● 1980 Rate: 74%
● Record high: 75% (1984)
● Record low: 62% (2010)
● 2016 Rate: 58%
● 1980 Rate: 79%
● Record high: 79% (1980)
● Record low: 57% (2011)
● 2016 Rate: 57%
● 1980 Rate: 62%
● Record high: 63% (1985)
● Record low: 55% (1998)
● 2016 Rate: 56%
● 1980 Rate: 75%
● Record high: 75% (1980)
● Record low: 56% (2016)
● 2016 Rate: 54%
● 1980 Rate: 67%
● Record high: 68% (1982)
● Record low: 51% (2010)
● 2016 Rate: 52%
● 1980 Rate: 59%
● Record high: 62% (1994)
● Record low: 51% (2014)
● 2016 Rate: 52%
● 1980 Rate: 55%
● Record high: 59% (1988)
● Record low: 51% (2002)
● 2016 Rate: 52%
● 1980 Rate: 60%
● Record high: 65% (1989)
● Record low: 47% (2006)
● 2016 Rate: 51%
● 1980 Rate: 60%
● Record high: 63% (1990)
● Record low: 48% (2010)
● 2016 Rate: 51%
● 1980 Rate: 54%
● Record high: 56% (1990)
● Record low: 43% (2004)
● 2016 Rate: 9%
● 1980 Rate: 21%
● Record high: 25% (1982)
● Record low: 7% (2013)
● 2016 Rate: 9%
● 1980 Rate: 19%
● Record high: 21% (1992)
● Record low: 9% (2016)
● 2016 Rate: 9%
● 1980 Rate: 25%
● Record high: 25% (1980)
● Record low: 7% (2015)
● 2016 Rate: 13%
● 1980 Rate: 22%
● Record high: 28% (1990)
● Record low: 12% (2014)
● 2016 Rate: 14%
● 1980 Rate: 13%
● Record high: 22% (1993)
● Record low: 10% (2013)
● 2016 Rate: 16%
● 1980 Rate: 39%
● Record high: 41% (1982)
● Record low: 16% (2016)
● 2016 Rate: 18%
● 1980 Rate: 41%
● Record high: 41% (1982)
● Record low: 18% (2016)
● 2016 Rate: 19%
● 1980 Rate: 28%
● Record high: 34% (1992)
● Record low: 16% (2012)
● 2016 Rate: 23%
● 1980 Rate: 31%
● Record high: 36% (1990)
● Record low: 22% (2008)
● 2016 Rate: 28%
● 1980 Rate: 45%
● Record high: 45% (1983)
● Record low: 26% (2003)


![Resurfaced FEMA meeting goes VIRAL in the wake of Helene: 'We’re not paying attention to [the LGBTQIA+] community'](https://www.theblaze.com/media-library/image.jpg?id=53780489&width=1245&height=700&quality=85&coordinates=0%2C0%2C0%2C0)