Image source: WalletHub
Ask just about anyone and they'll tell you hard work, grit and determination have made America into what it is today.
But exactly where do the hardest-working Americans live? Do urban dwellers spend more time on the clock than those who live in more rural areas? Or could less traffic and congestion translate into more time at work?
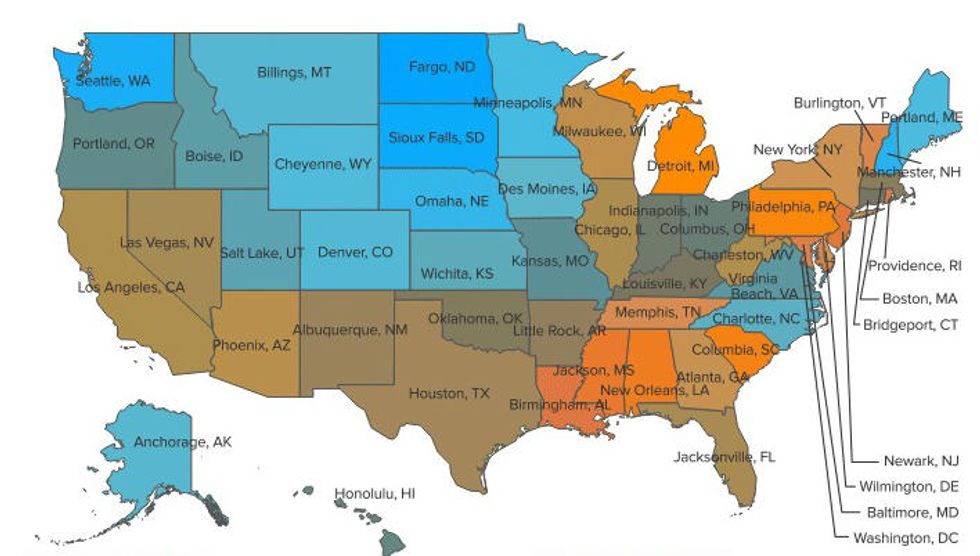
Ahead of Employee Appreciation Day on Friday, WalletHub published a map showing the "hardest-working" cities in America. To do so, it looked at the labor force participation rate, average weekly work hours and the number of workers with multiple jobs in 116 of the country's most-populated cities.
Below is the map showing which areas came out on top:
 Image source: WalletHub
Among the hardest-working cities were several municipalities in Texas, including Plano, Irving, Garland, Arlington and Dallas. Cities that made the list on the East Coast were Virginia Beach, Virginia, Charlotte, North Carolina, Washington, D.C. and Jersey City, New Jersey.
Farther West, Denver, Colorado, Cheyenne Wyoming, San Francisco, California, and Gilbert, Arizona held some of top spots. Anchorage, Alaska, was number one.
The survey includes at least one city from each state and only takes into consideration the city proper, not any of the surrounding metropolitan areas. The data used to determine the ranking was gathered from a variety of sources, including the U.S. Census Bureau, the U.S. Bureau of Labor Statistics, the Corporation for National & Community Service and SleepBetter.org.
WalletHub looked at several factors to determine the ranking and weighted most of them differently. The asterisks indicate the respective data were only available on the state level as opposed to nationally.
Here are the criteria:
The survey also revealed changes in labor participation rates by cities in every state from 2007-2013. The below map is a color-coded time lapse of those data:

You can see the view the full ranking on WalletHub's website by clicking here.
(H/T: WalletHub)
–
Follow Jon Street (@JonStreet) on Twitter