© 2026 Blaze Media LLC. All rights reserved.
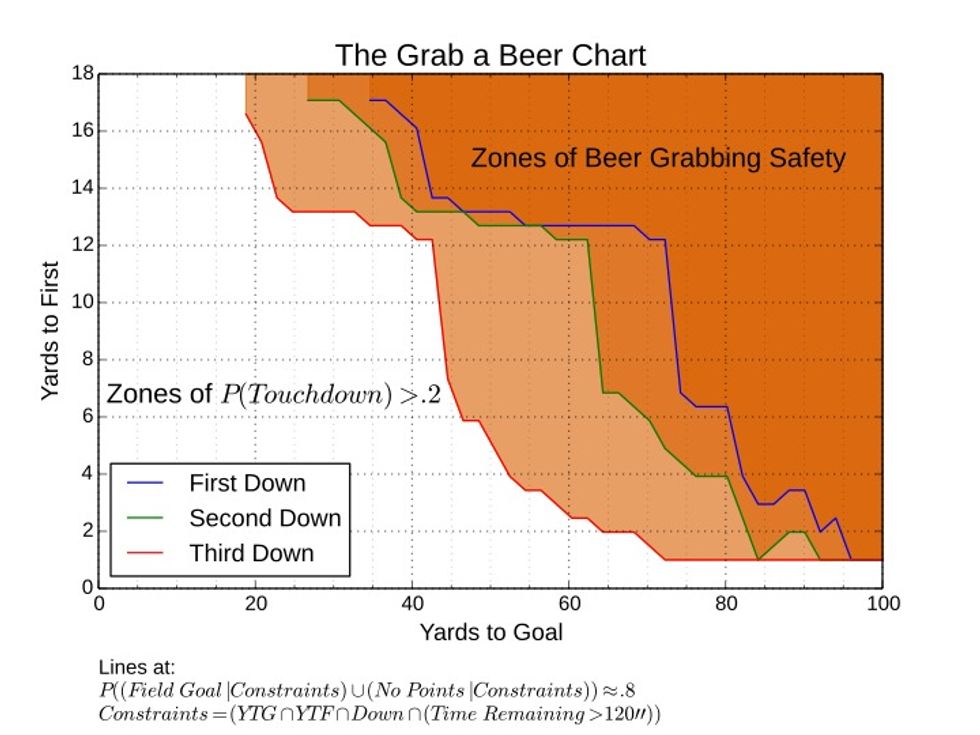
Football plus beer plus the power of the computer — it was only a matter of time before the "Grab a Beer Chart" was produced.
Seeking the definitive answer to the age-old question, "When can I go grab a beer during a football game without missing part of a scoring drive?" Reddit user bkrn pulled information on every NFL play since 1998 and worked some statistical magic to produce the chart below.
 Image via imgur
The chart reveals a few obvious facts — teams are more likely to score the closer they get to the end zone and turnovers are more likely in the third than first down — as well as demonstrating the way teams tend to falter once they've been pushed back past 13 yards to the next down.
For those who are interested, bkrn broke down the methodology behind the chart, based on data from some 600,000 plays, here.
"Obviously this was all just an amusing way of saying don't leave when the team advances far up the field," born acknowledged, "but I thought it was fun and, for me, instructive."
—
Follow Zach Noble (@thezachnoble) on Twitter
Want to leave a tip?
We answer to you. Help keep our content free of advertisers and big tech censorship by leaving a tip today.
Want to join the conversation?
Already a subscriber?