Image source: YouTube
Last month, animator Max Galka published a stunning multicolored time-lapse map of world population immigration to the United States from 1820 to 2013 on his creative data blog, Metrocosm.
On Wednesday, he released his latest visualization, which shows the history of urbanization over the course of nearly six millennia in three minutes.
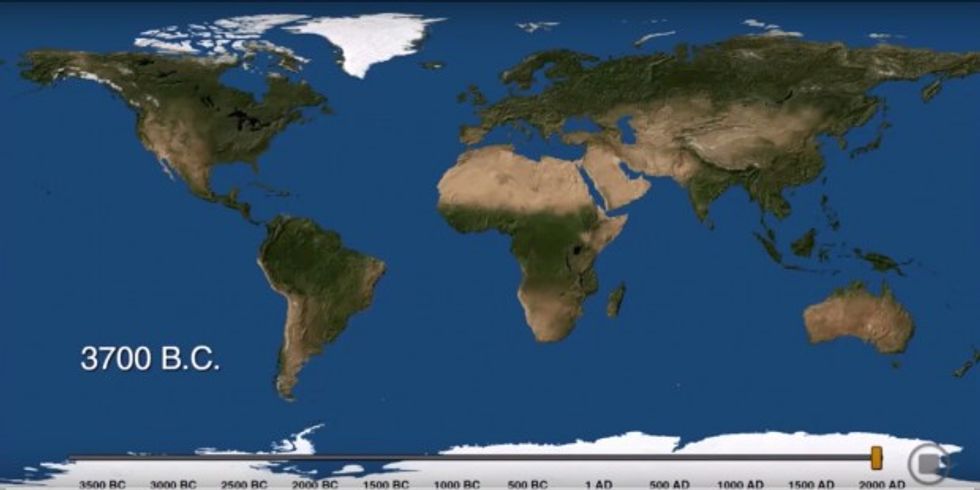 Image source: YouTube
Beginning in 3700 B.C. with Sumer, the ancient city believed to be the world’s first urban civilization, the map shows the growth of urban settlements.
Galka notes on his blog that tracking urbanization that occurred before the mid-20th century was a difficult task up until very recently, when a team of Yale researchers released a comprehensive collection of urban population data dating back to ancient times.
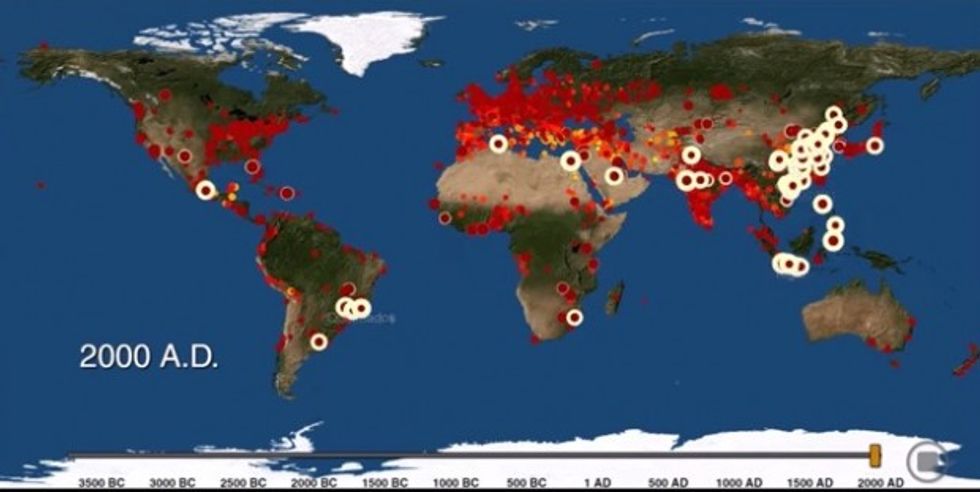 Image source: YouTube
Today, about 54 percent of the world’s population live in cities. By 2030, that share is expected to climb to 75 percent, a significant jump from 1960, when only 34 percent of the world lived in cities.
The Yale researchers collected the data through a process of digitizing, geocoding and standardizing information from past research published about historical urban populations. Galka, who describes himself as “a guy who is fascinated by data,” called the report “a clean, accessible dataset of cities, their locations and their populations over time.”
Watch: