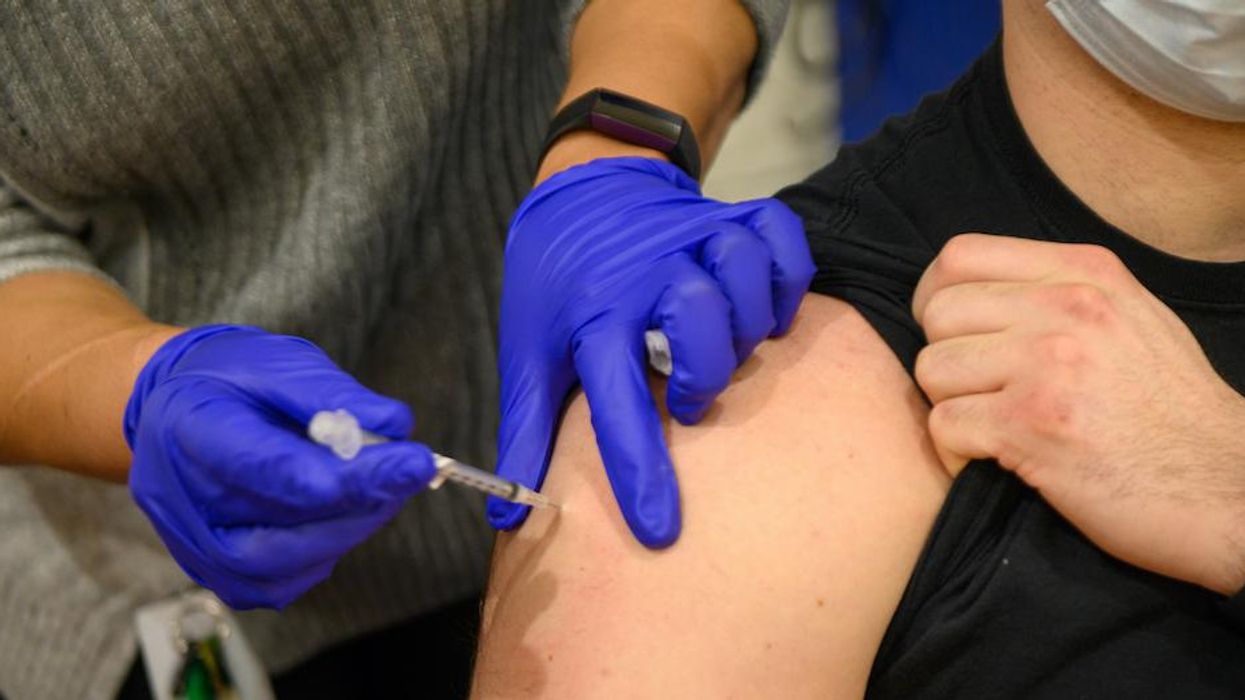
Photographer: Christopher Occhicone/Bloomberg via Getty Images

Getting it done
According to the Centers for Disease Control and Prevention, some 29.4 million COVID-19 vaccine doses have been distributed across the states and territories. Only about one-third (10.3 million) of those doses have been administered. And most of those doses were given to health care workers and the staff and residents of long-term-care facilities, Fortune noted.
With only about 3% of U.S. population having received the vaccine so far, how are the individual states doing?
West Virginia is leading the way, significantly out-pacing other states with 6,177 doses administered per 100,000 residents as of Wednesday. It's followed by South Dakota (5,732 per 100K), North Dakota (5,344), Alaska (5,287), and Vermont (4,739).
The four of the bottom five are Southern states, with Alabama coming in with the worst record so far on per capita vaccinations. The Yellowhammer State has administered 1,714 doses per 100,000 residents, according to the most recent CDC data. It is followed by Georgia (1,872 per 100K), South Carolina (1,940), Nevada (2,002), and Mississippi (2,059).
Below are the 10 states doing the best and the 10 states doing the worst — so far — on per capita vaccinations, based on CDC data accessed Wednesday, Jan. 13.
No. 1: West Virginia
● Rate per 100,000: 6,177
No. 2: South Dakota
● Rate per 100,000: 5,732
No. 3: North Dakota
● Rate per 100,000: 5,344
No. 4: Alaska
● Rate per 100,000: 5,287
No. 5: Vermont
● Rate per 100,000: 4,739
No. 6: Connecticut
● Rate per 100,000: 4,540
No. 7: Oklahoma
● Rate per 100,000: 4,357
No. 8: Maine
● Rate per 100,000: 4,259
No. 9: Colorado
● Rate per 100,000: 4,162
No. 10: Montana
● Rate per 100,000: 4,123
No. 1: Alabama
● Rate per 100,000: 1,714
No. 2: Georgia
● Rate per 100,000: 1,872
No. 3: South Carolina
● Rate per 100,000: 1,940
No. 4: Nevada
● Rate per 100,000: 2,002
No. 5: Mississippi
● Rate per 100,000: 2,059
No. 6: Arizona
● Rate per 100,000: 2,126
No. 7: Idaho
● Rate per 100,000: 2,175
No. 8: California
● Rate per 100,000: 2,256
No. 9: Wisconsin
● Rate per 100,000: 2,357
No. 10: North Carolina
● Rate per 100,000: 2,545