© 2026 Blaze Media LLC. All rights reserved.
A credit repair law firm is used to seeing people with financial struggles, and now they've put together an interactive report so that everyone else can, too.
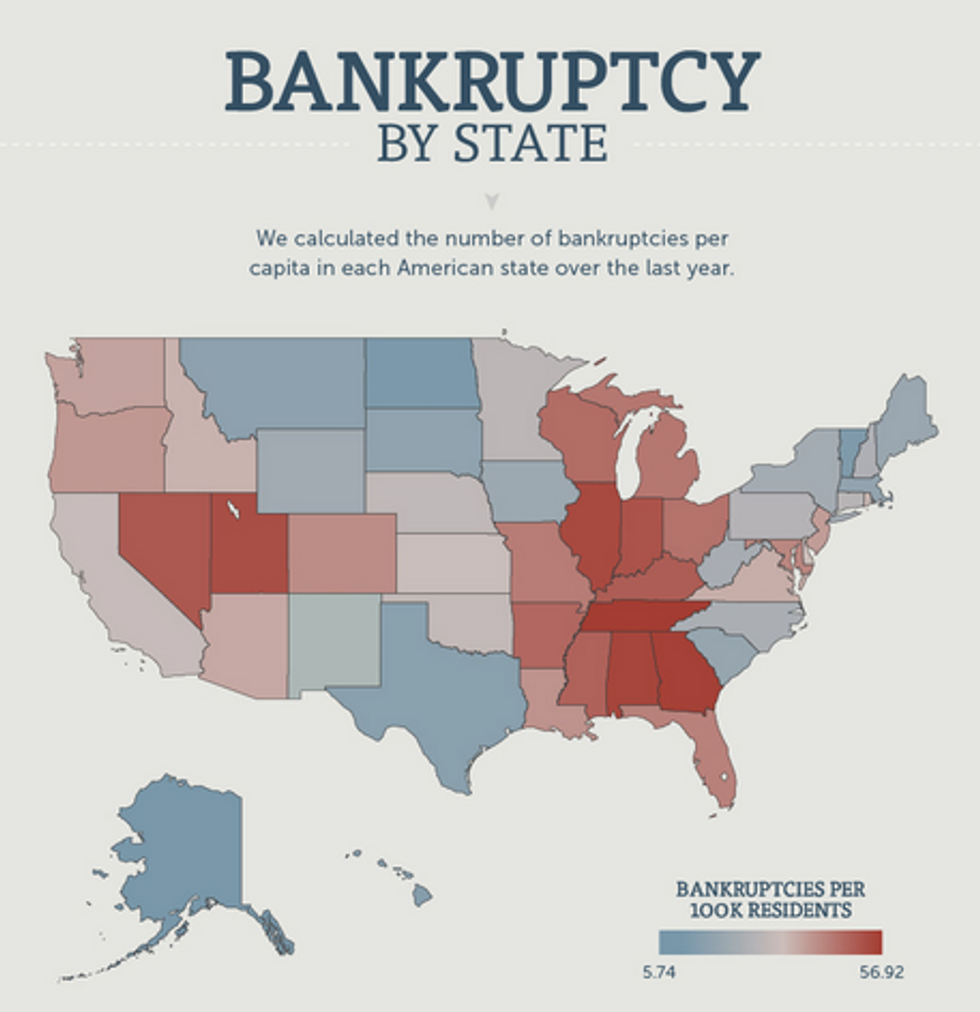
Lexington Law, a firm that bills itself as the leading credit repair firm, has compiled an interactive project that reveals the per capita rate of bankruptcy in every American county and state. The firm found that while some counties and states mired in bankruptcies also had high poverty rates, not every county or state did.
In fact, according to the law firm's report, "no economic segment of the country seems immune to bankruptcy," as even "above the average income marker, bankruptcies appear at per capita rates similar to the average overall."
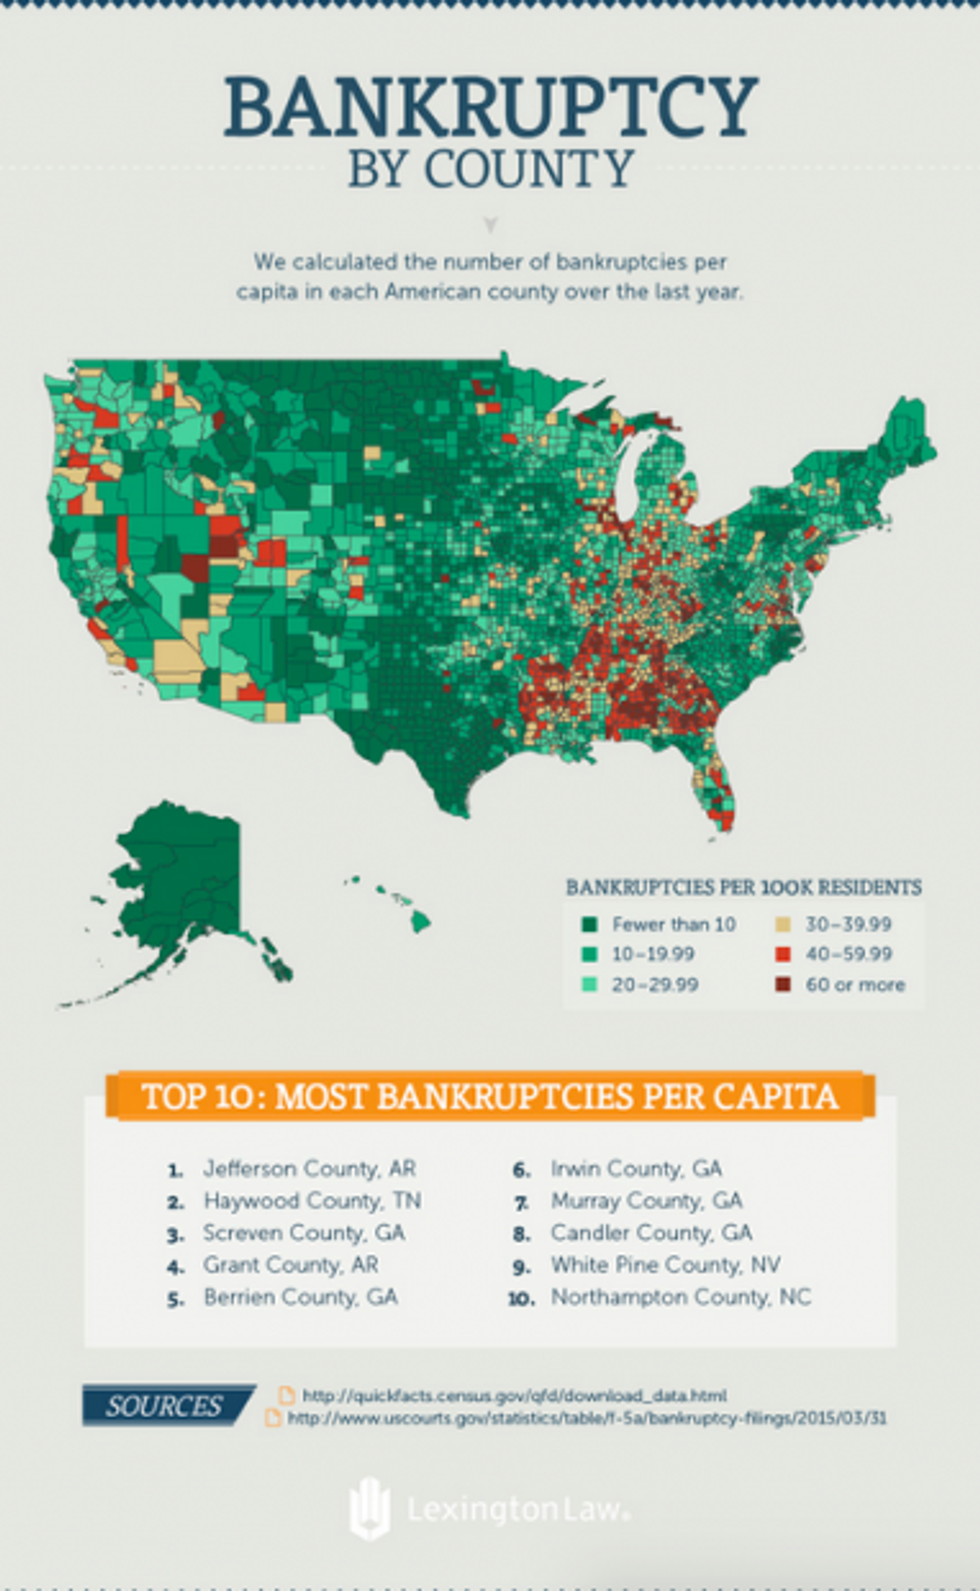 Image courtesy of Lexington Law.
According to the law firm, all but two of the top 10 bankrupt counties are in Arkansas, Georgia or Tennessee. The states with the most bankruptcies per capita are: Tennessee, Georgia, Alabama, Illinois and Utah.
Alaska; North Dakota; Vermont; Washington, D.C. and Hawaii were the five states with the least amount of bankruptcies per capita.
A spokesperson for Lexington Law told TheBlaze that eight out of the 10 states with the most bankruptcies per capita voted for Republican presidential candidate Mitt Romney in the 2012 election.
"Perhaps this is due to their continued experience of economic hardship during Obama's first term? Just a thought," the spokesperson speculated.
The spokesperson pointed out that Illinois, the state the president represented while a U.S. senator, is also mired in bankruptcy — ranking 4th overall.
"Lexington won’t be sending this to lawmakers, or trying to effect any specific political action," a spokesperson for the company told TheBlaze. "But we will be available to help any person or family in need or our services, and we hope this project reaches anyone looking for help."
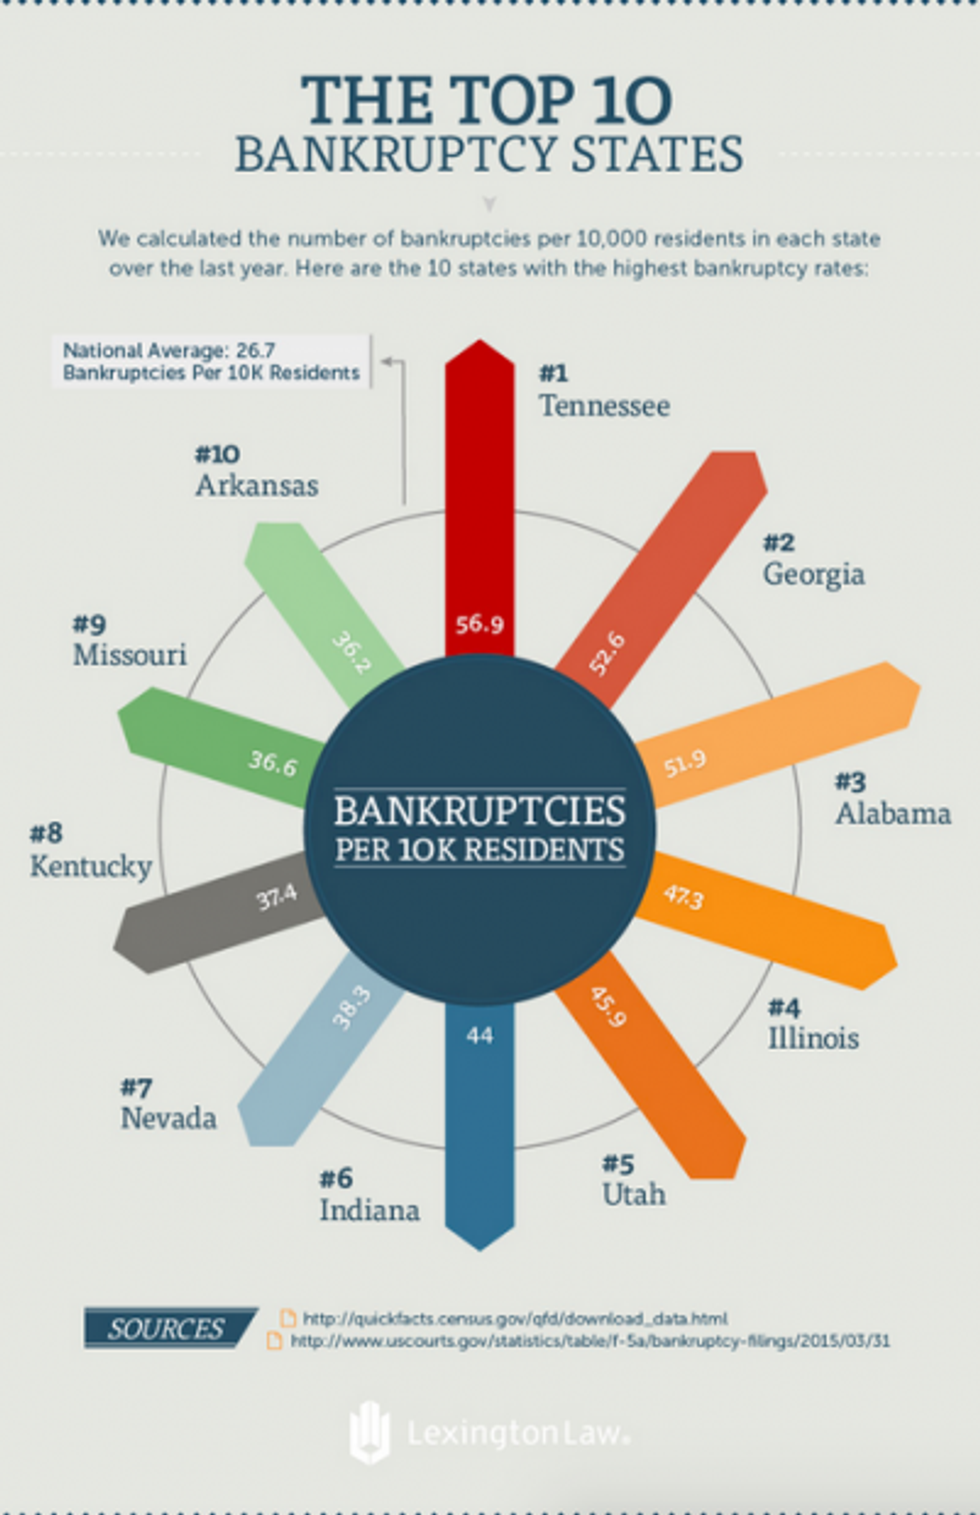 Image courtesy of Lexington Law.
Members of Lexington Law utilized the most recent data from the U.S. Census and the U.S. Federal Courts to compile their graphics from March 2014 to March 2015.
See how your state and county compares to others with Lexington Law's interactive maps below.


Want to leave a tip?
We answer to you. Help keep our content free of advertisers and big tech censorship by leaving a tip today.
Want to join the conversation?
Already a subscriber?