© 2026 Blaze Media LLC. All rights reserved.
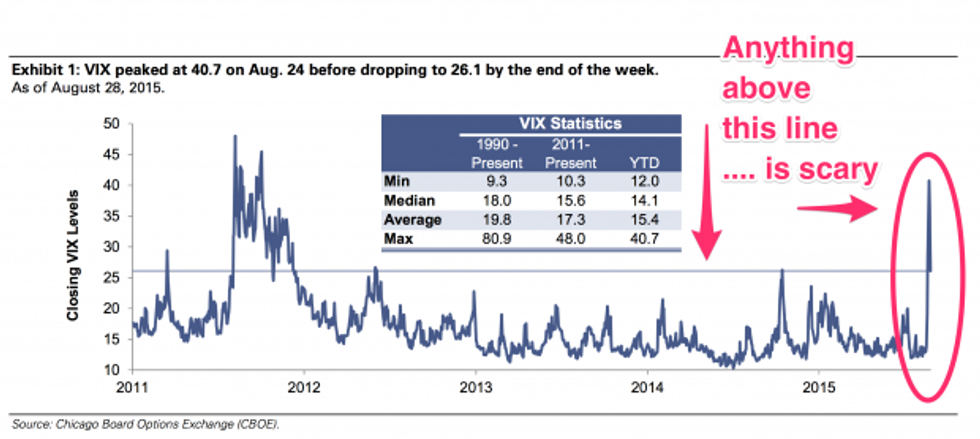
When the VIX — an “index of volatility” in the S&P 500 stocks — hits “levels in the high-twenties to low-thirties” for extended periods of time, it’s usually an indicator that the U.S. economy is headed for a recession, according to a Goldman Sachs analyst.
Goldman Sachs released the graph below to put this issue into perspective -- and as you can see, the index is currently at "scary" levels.
 Goldman Sachs/Business Insider
“VIX levels go back to January 1990. Since that time there have been three recessions. Average VIX levels in the first two recessions (1990-1991, 2001) were 25 and 26 respectively,” Goldman Sachs analyst Krag Gregory said. “The worst of the worst was of course the Great Financial Crisis. Average VIX levels in the 2008-2009 recession were 34.”
After a dramatic spike during last week's turbulent period, the VIX landed at 26 at the end of the week.
More insight from Business Insider:
Volatility in stock trading is not, on its own, an indicator of a decline in economic activity. But it does usually indicate that investors are nervous and twitchy about the way things are going, and thus trading their shares more frequently. That scenario often occurs right before the economy takes a nosedive.[…]
At the end of last week, the VIX stood at 26, even though Q2 GDP for the US was a healthy 3.7% and, and similarly robust levels of GDP growth are currently being seen in the major UK and European countries. The chart is doubtless driven by knock-on effects from the massive sell-off in China stocks. Those stocks are down because a lot ofanalysts doubt that Chinese economic growth is as strong as the government says it is. With the Chinese economic engine slowing down, the fear is that it might hurt growth worldwide.
In turn, the Chinese sell-off triggered a rollercoaster collapse-and-rally last week in the S&P 500.
Read the full report here.
---
Want to leave a tip?
We answer to you. Help keep our content free of advertisers and big tech censorship by leaving a tip today.
Want to join the conversation?
Already a subscriber?